
Take a model of this shape on Microsoft's public Contoso retail sample: about 12 million online sales rows, a few thousand products, a handful of years of dates. That is not big. It opens in about 40 seconds, a figure typical for a model of this shape rather than a measurement, and nothing is wrong with the data. The model makes it feel big, and every one of the symptoms comes from a modelling decision, not from the volume.
One thing to say plainly before the numbers. The figures in this article, 40 seconds to under three, a 3 hour refresh to 12 minutes, 1.8 GB in memory to 600 MB, are typical for a model of this shape. They are not measurements from a benchmark. Yours will differ. The order of the fixes will not.
The symptoms
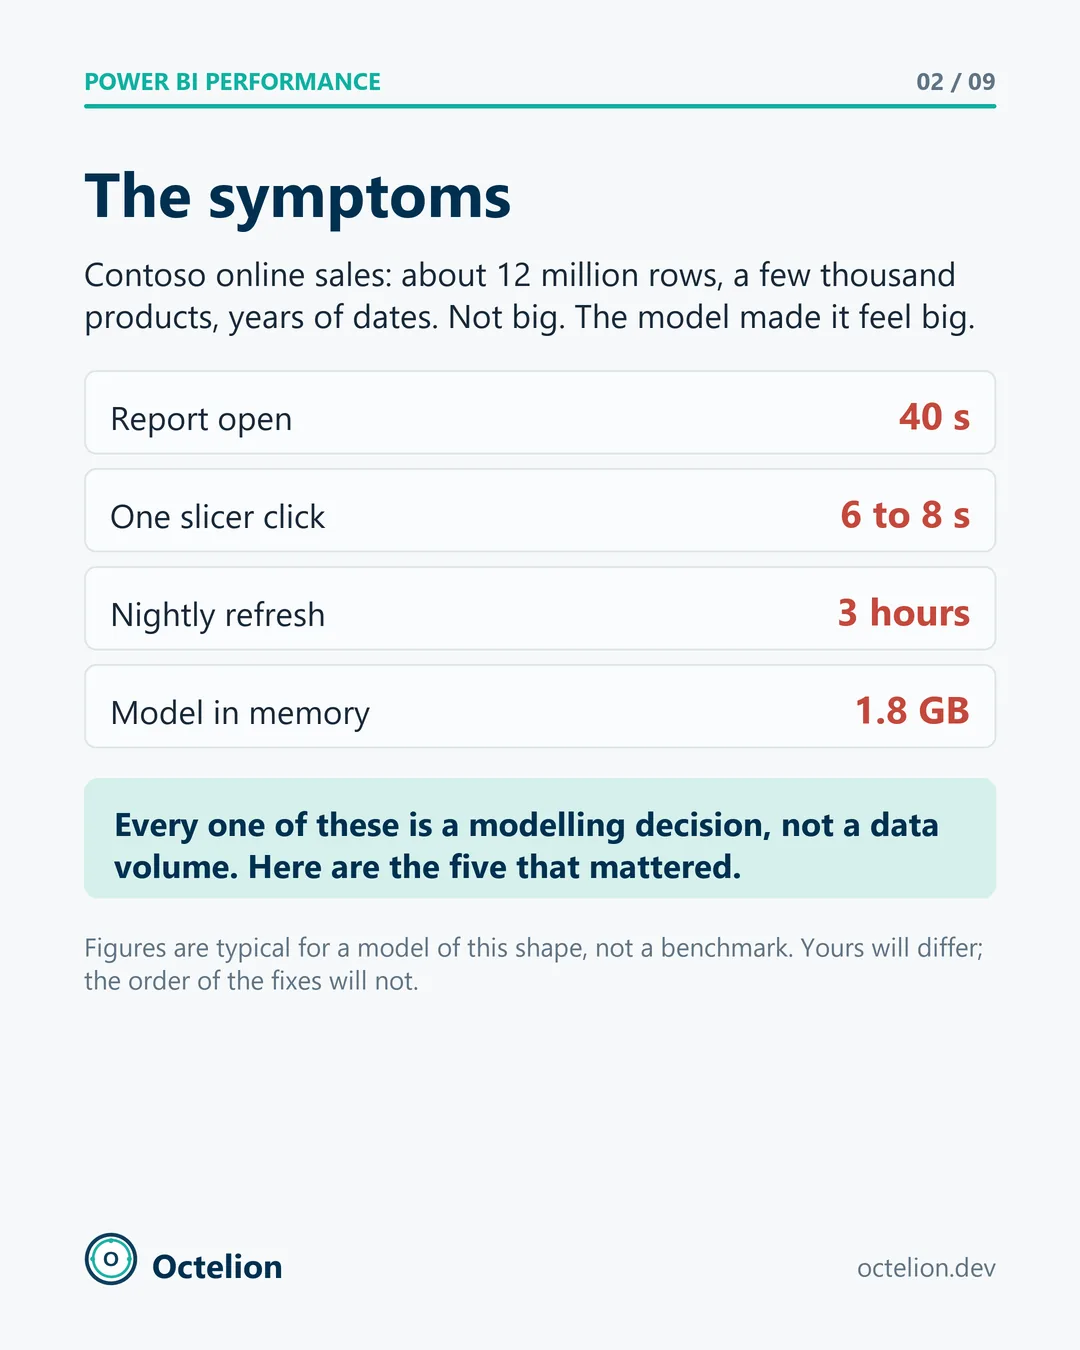
Report open: 40 seconds. One slicer click: 6 to 8 seconds. Nightly refresh: 3 hours. Model in memory: 1.8 GB. Fourteen relationships, five of them two-way. Each of those is a symptom with a specific cause, and the causes stack. Here are the five that mattered, in the order we apply them.
How to tell which fix you need
Before changing anything, measure where the time goes, because the five fixes attack different costs. Performance Analyzer in Power BI Desktop splits each visual into DAX query time and visual render time; if DAX dominates, the model is the problem. DAX Studio's server timings split the query again, into storage engine time, which is the column store scanning rows, and formula engine time, which is single-threaded DAX logic. Heavy storage engine time with many small scans points at relationships and snowflakes (fixes 1 and 2). Heavy formula engine time points at measures written against calculated columns (fix 3). VertiPaq Analyzer lists every column with its size, and a derived decimal column near the top of that list is fix 3 again. Refresh history in the service, with a run that takes hours for a table that gains a few thousand rows a day, is fix 4. A landing page whose visuals each scan the whole fact table is fix 5. Ten minutes with these tools usually names the fix before the first change is made.
Fix 1: flatten the snowflake into a star
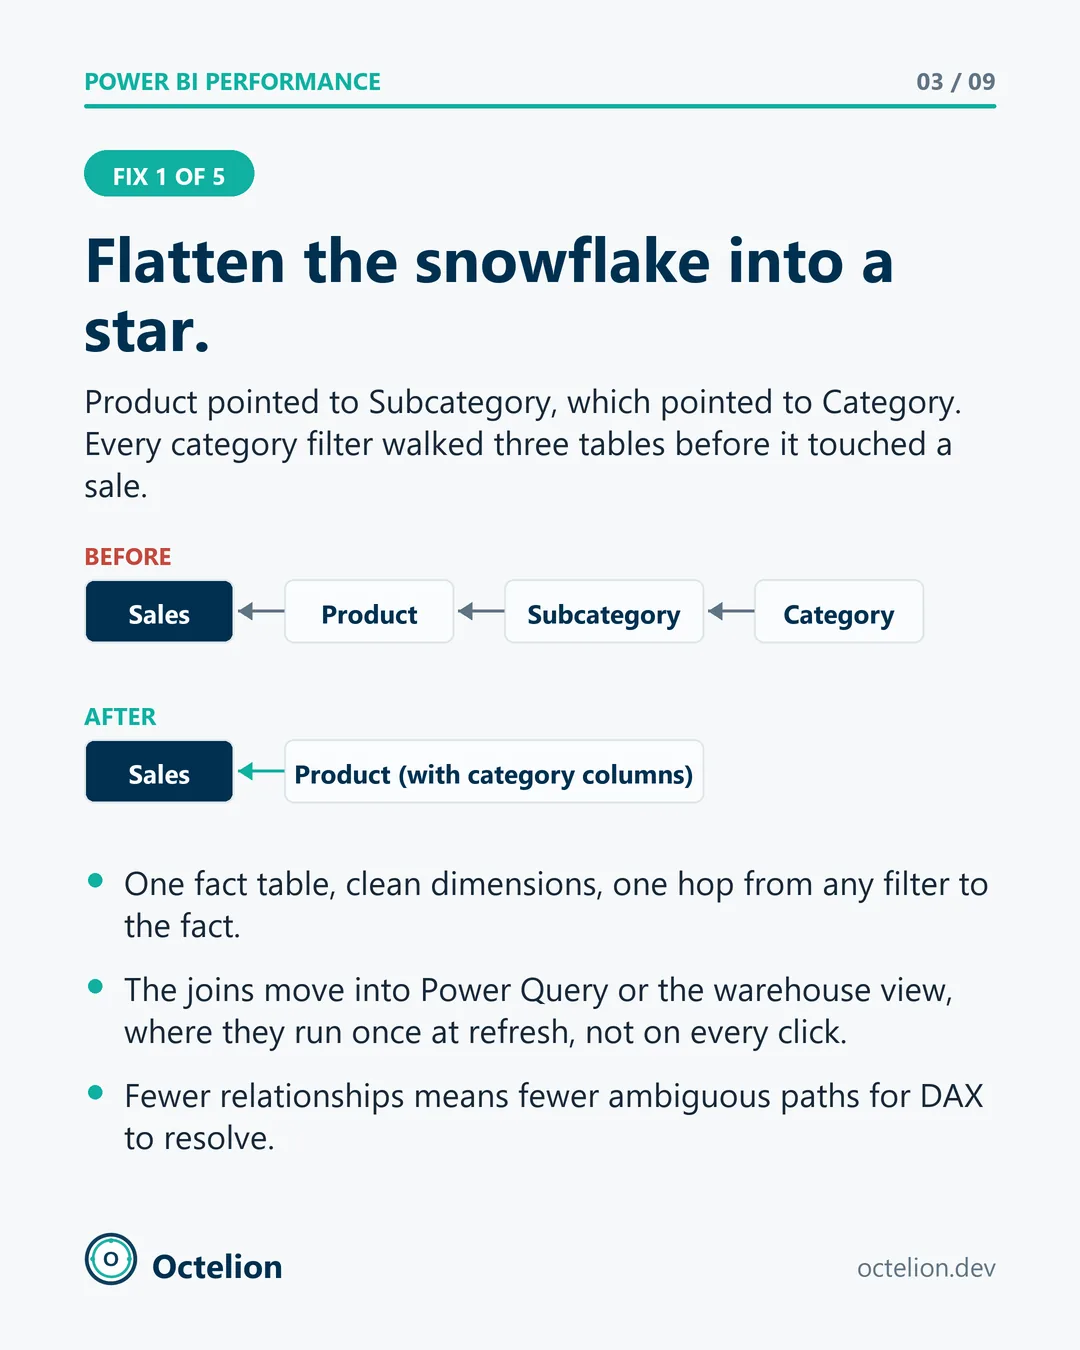
Product pointed to Subcategory, which pointed to Category. Every category filter walked three tables before it touched a sale. The fix is a star: one fact table, clean dimensions, one hop from any filter to the fact. The category columns move onto the Product table. The joins move into Power Query or a warehouse view, where they run once at refresh instead of on every click. Fewer relationships also means fewer ambiguous paths for the engine to resolve, which matters more than it sounds once the model has a few dozen measures. The check is simple: open Model view and count the hops from the furthest dimension to the fact. If the answer is more than one, there is a snowflake to flatten.
Fix 2: kill the bi-directional relationships
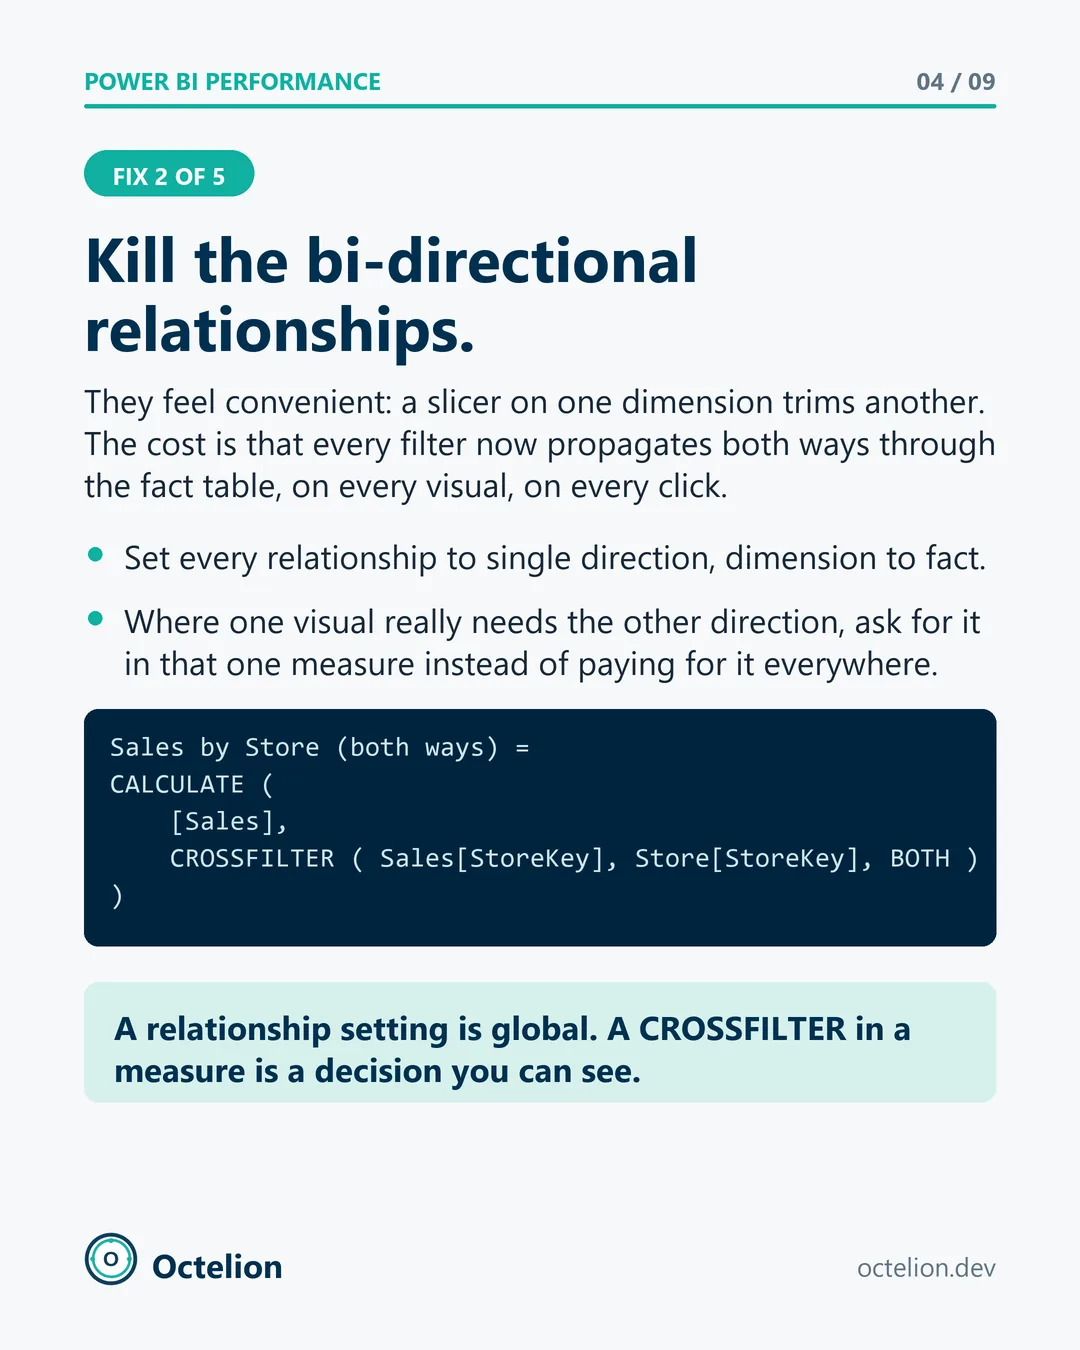
Two-way relationships feel convenient. A slicer on one dimension trims another, and nobody has to think about it. The cost is that every filter now propagates both ways through the fact table, on every visual, on every click. Set every relationship to single direction, dimension to fact. Where one visual really does need the other direction, ask for it inside that one measure, so the cost is paid there and nowhere else:
Sales by Store (both ways) =
CALCULATE (
    [Sales],
    CROSSFILTER ( Sales[StoreKey], Store[StoreKey], BOTH )
)
A relationship setting is global and invisible. A CROSSFILTER in a measure is a decision you can see, review and remove. In Model view, two-way relationships show as double-headed arrows; counting them is the first audit we run on any inherited model.
Fix 3: measures, not calculated columns
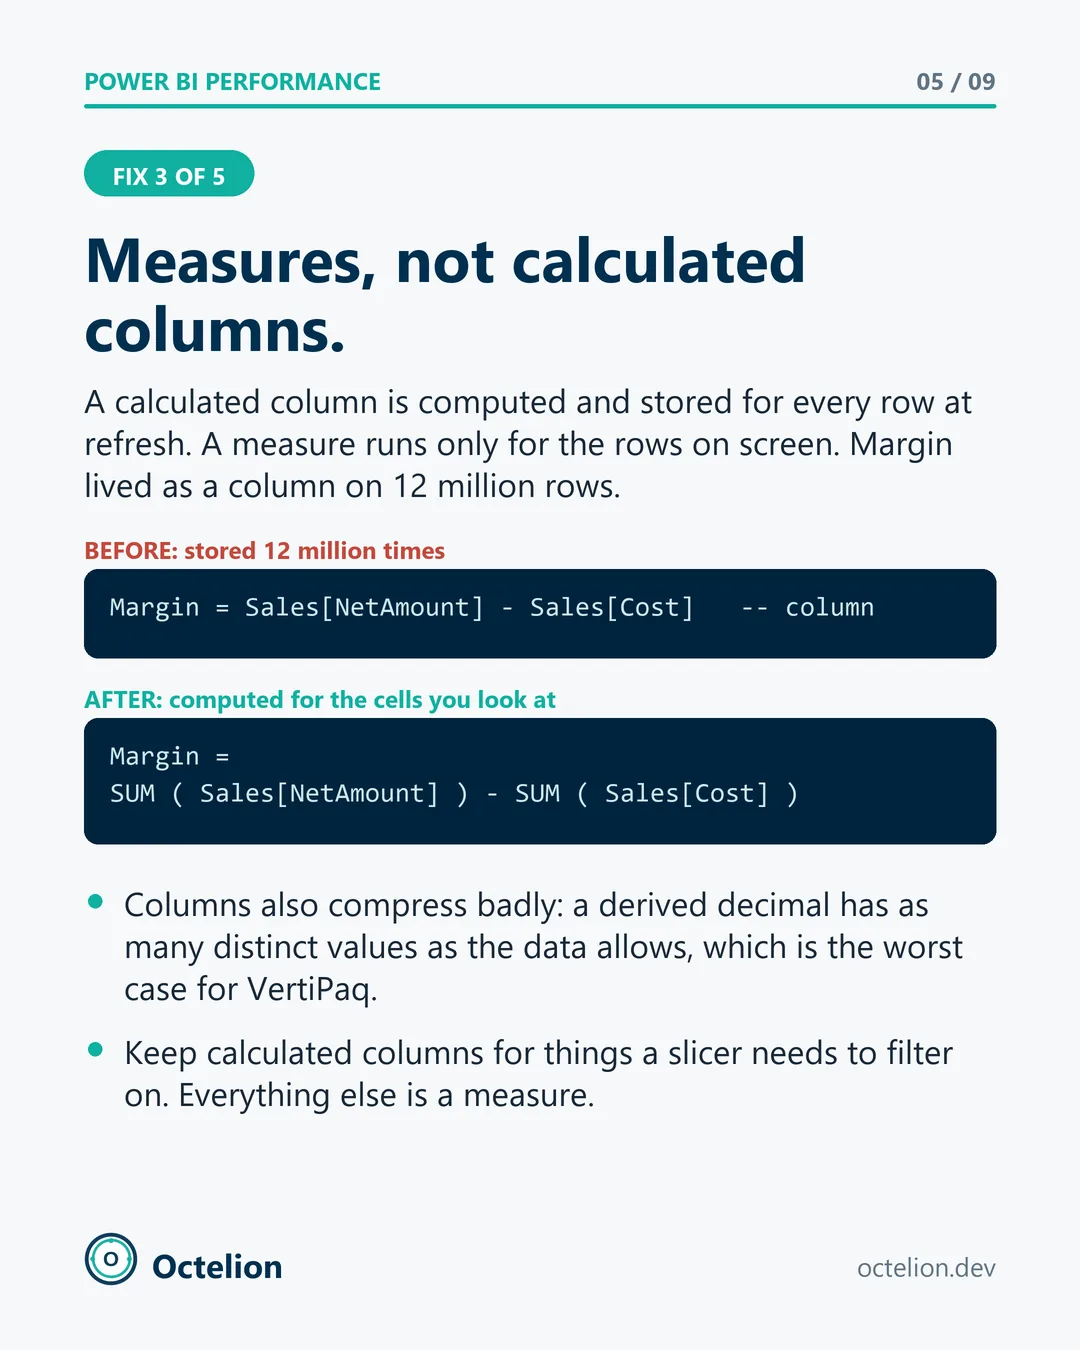
A calculated column is computed and stored for every row at refresh. A measure runs only for the rows on screen. In this model, margin lived as a column on 12 million rows:
Margin = Sales[NetAmount] - Sales[Cost]Stored 12 million times, and compressing badly, because a derived decimal has as many distinct values as the data allows, which is the worst case for the column store. The same number as a measure is computed only for the cells someone is looking at:
Margin =
SUM ( Sales[NetAmount] ) - SUM ( Sales[Cost] )
Keep calculated columns for things a slicer needs to filter on. Everything else is a measure. The change from this fix alone is visible in VertiPaq Analyzer before and after: the column disappears and the model shrinks by its size.
Fix 4: incremental refresh with a real range
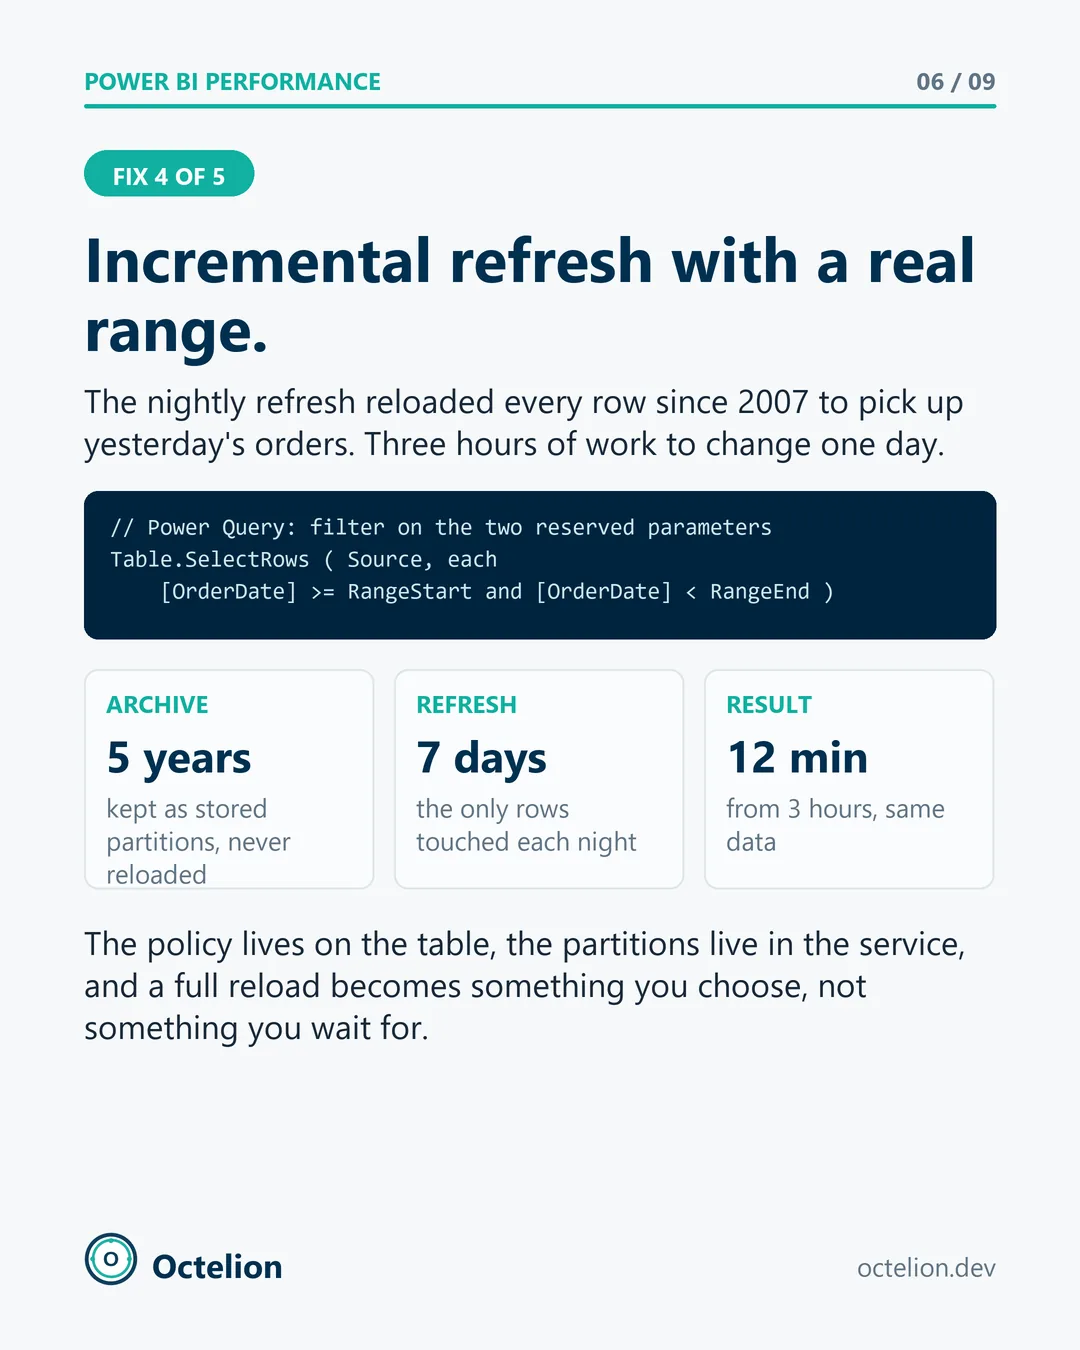
The nightly refresh reloaded every row since 2007 to pick up yesterday's orders. Three hours of work to change one day. Incremental refresh needs one filter in Power Query on the two reserved parameters:
Table.SelectRows ( Source, each
    [OrderDate] >= RangeStart and [OrderDate] < RangeEnd )
With that in place, the policy on the table keeps five years as stored partitions that are never reloaded and refreshes the last seven days each night. The result for a model of this shape is a refresh of around 12 minutes instead of 3 hours, on the same data. A full reload becomes something you choose, not something you wait for.
One caution. The policy quietly requires the date column to be a date or datetime type, and the filter to fold back to the source. If the source step does not fold, the service pulls everything and filters in memory, and the three hours come back.
Fix 5: aggregation tables for the pages everyone opens
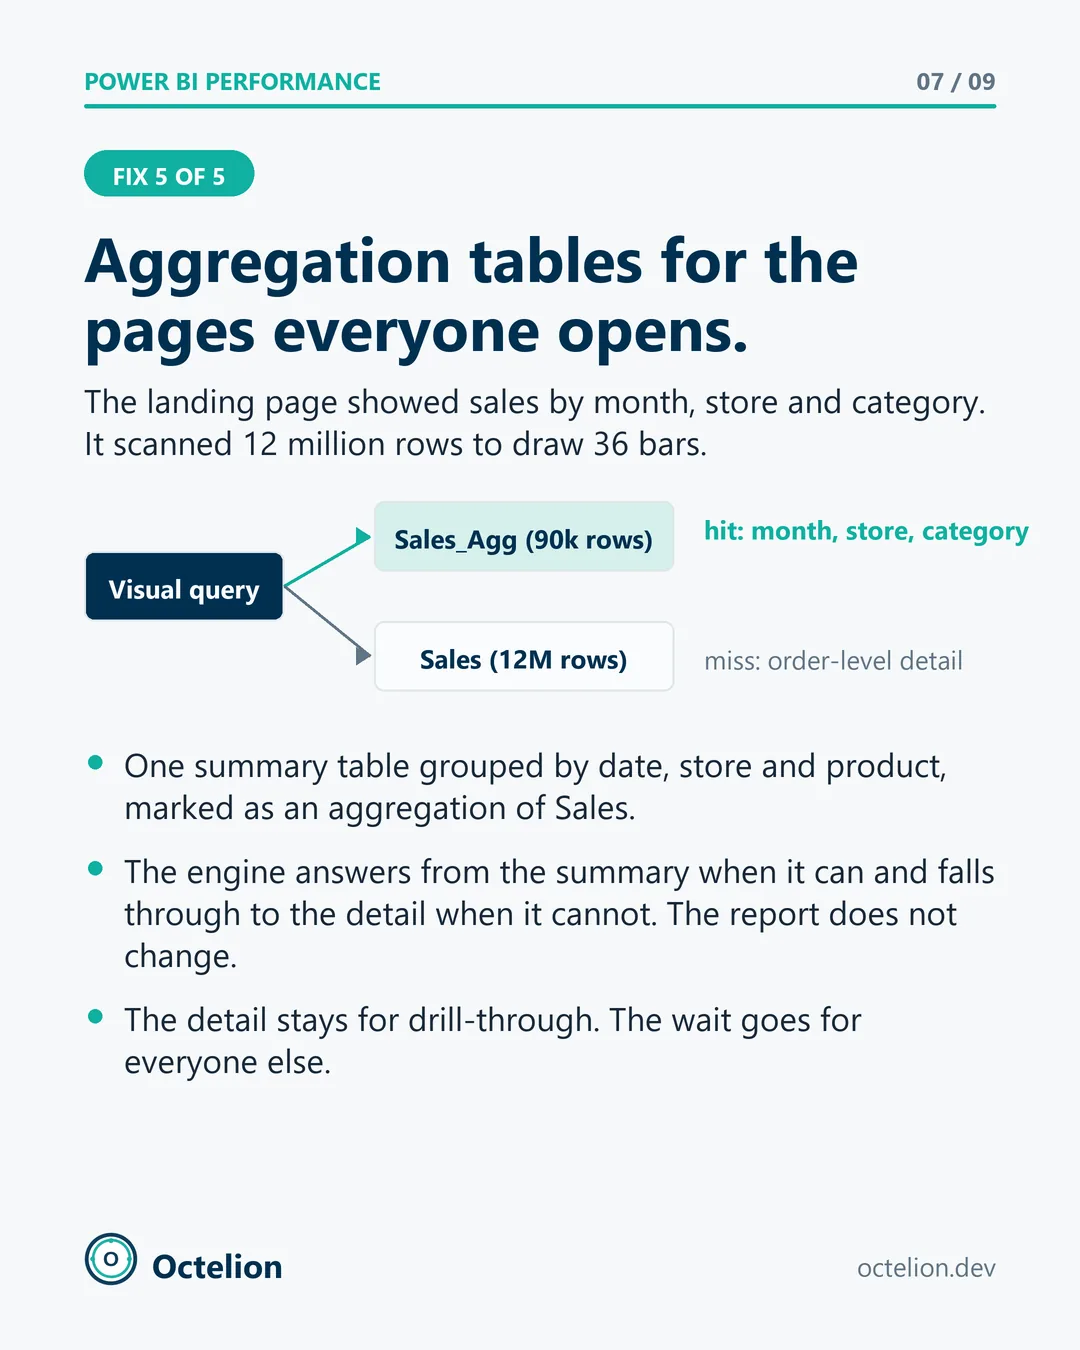
The landing page showed sales by month, store and category. To draw 36 bars it scanned 12 million rows. The fix is one summary table, grouped by month, store and category, marked as an aggregation of the Sales table. Around 90 thousand rows instead of 12 million. The engine answers from the summary when the question fits and falls through to the detail when it does not. The report does not change. The detail stays for drill-through. The wait goes for everyone else. You can confirm the hit in DAX Studio: a query that resolves against the aggregation shows the summary table in the storage engine scan, not the 12 million row fact.
Before and after
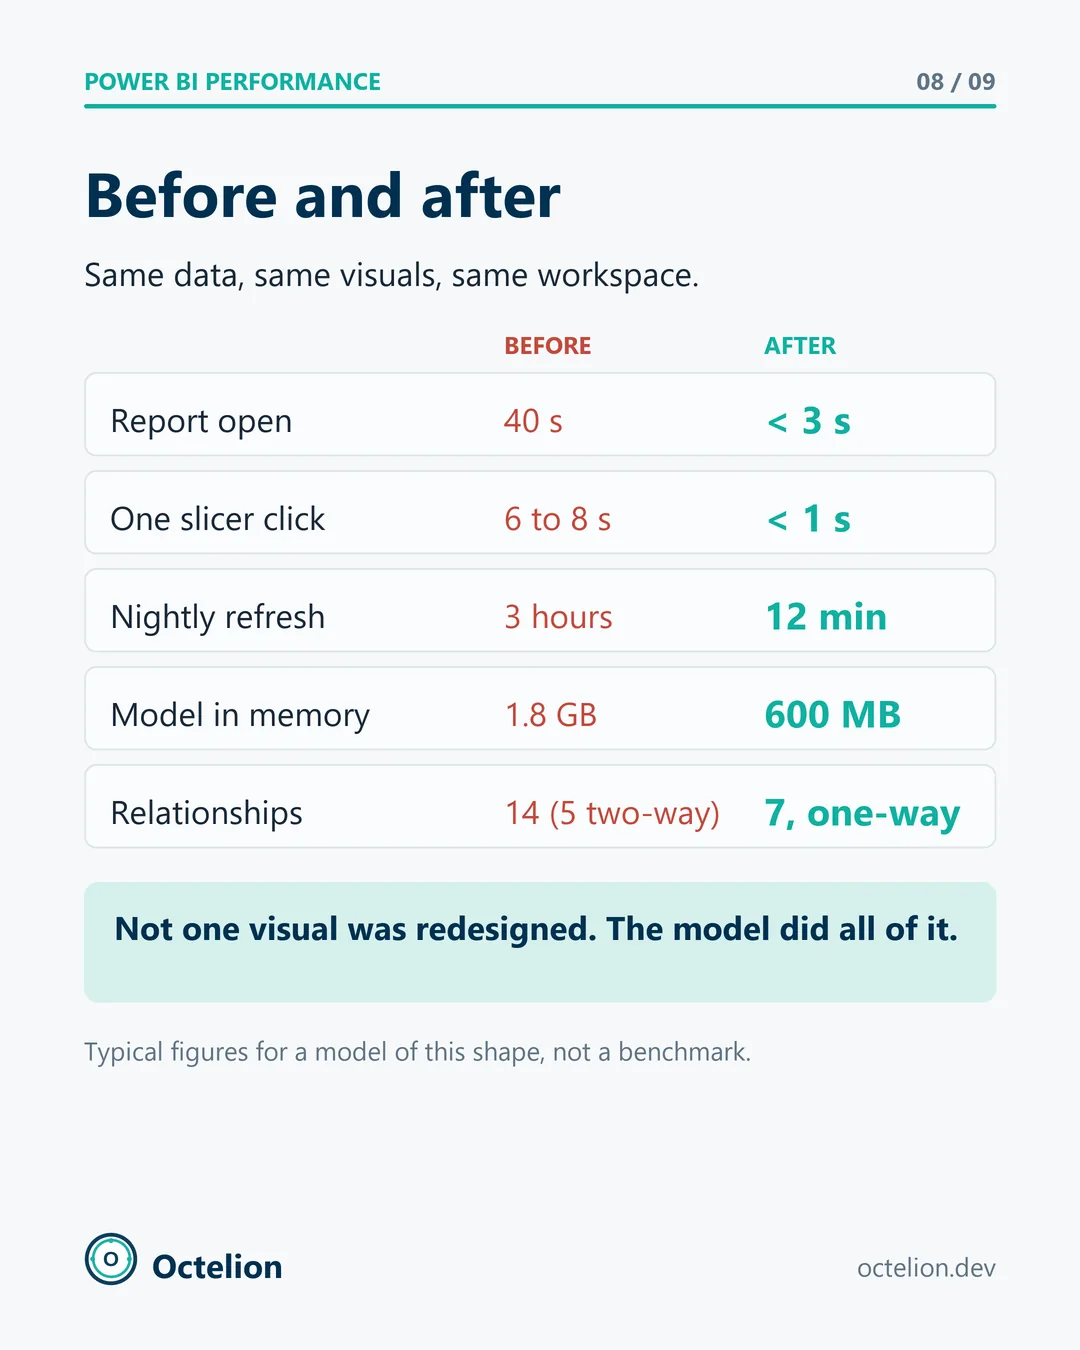
Same data, same visuals, same workspace. Report open from 40 seconds to under three. A slicer click from 6 to 8 seconds to under one. Nightly refresh from 3 hours to 12 minutes. Model in memory from 1.8 GB to 600 MB. Relationships from 14, five of them two-way, to 7, all one-way. Not one visual was redesigned. The model did all of it. And once more, because it matters: those are typical figures for a model of this shape, not a benchmark we ran. The point is the ratio and the order, not the digits.
The two bars of report open time draw with JavaScript. The numbers are in the caption: 40 seconds before, under 3 seconds after.
Why the order matters
The five fixes are not independent. The star schema removes the extra hops, which is what makes single-direction relationships safe. Single direction is what makes a CROSSFILTER measure a local decision rather than a global one. Measures instead of columns shrink the model, which makes incremental refresh partitions smaller. And the aggregation table only pays off once the fact table is clean enough for the engine to match questions against it. Do them in order and each one makes the next easier. Do the last one first and you get a fast landing page sitting on a model that still takes three hours to refresh.
Slow reports are a modelling problem wearing a data costume. When a report is slow, the first instinct is to blame the volume, buy a bigger capacity, or ask for a smaller dataset. On reports of this size the data is rarely the problem. The model is. Star schema, single-direction relationships, measures, incremental refresh, aggregations. In that order, every time.