
Work and research
We cannot show client systems, so we show the same methods on public data instead. Every measured number on these pages can be recomputed from a file you can download, and the query that produced it is on the page. Where a figure is a pattern rather than a measurement, the page says so.
Walkthroughs
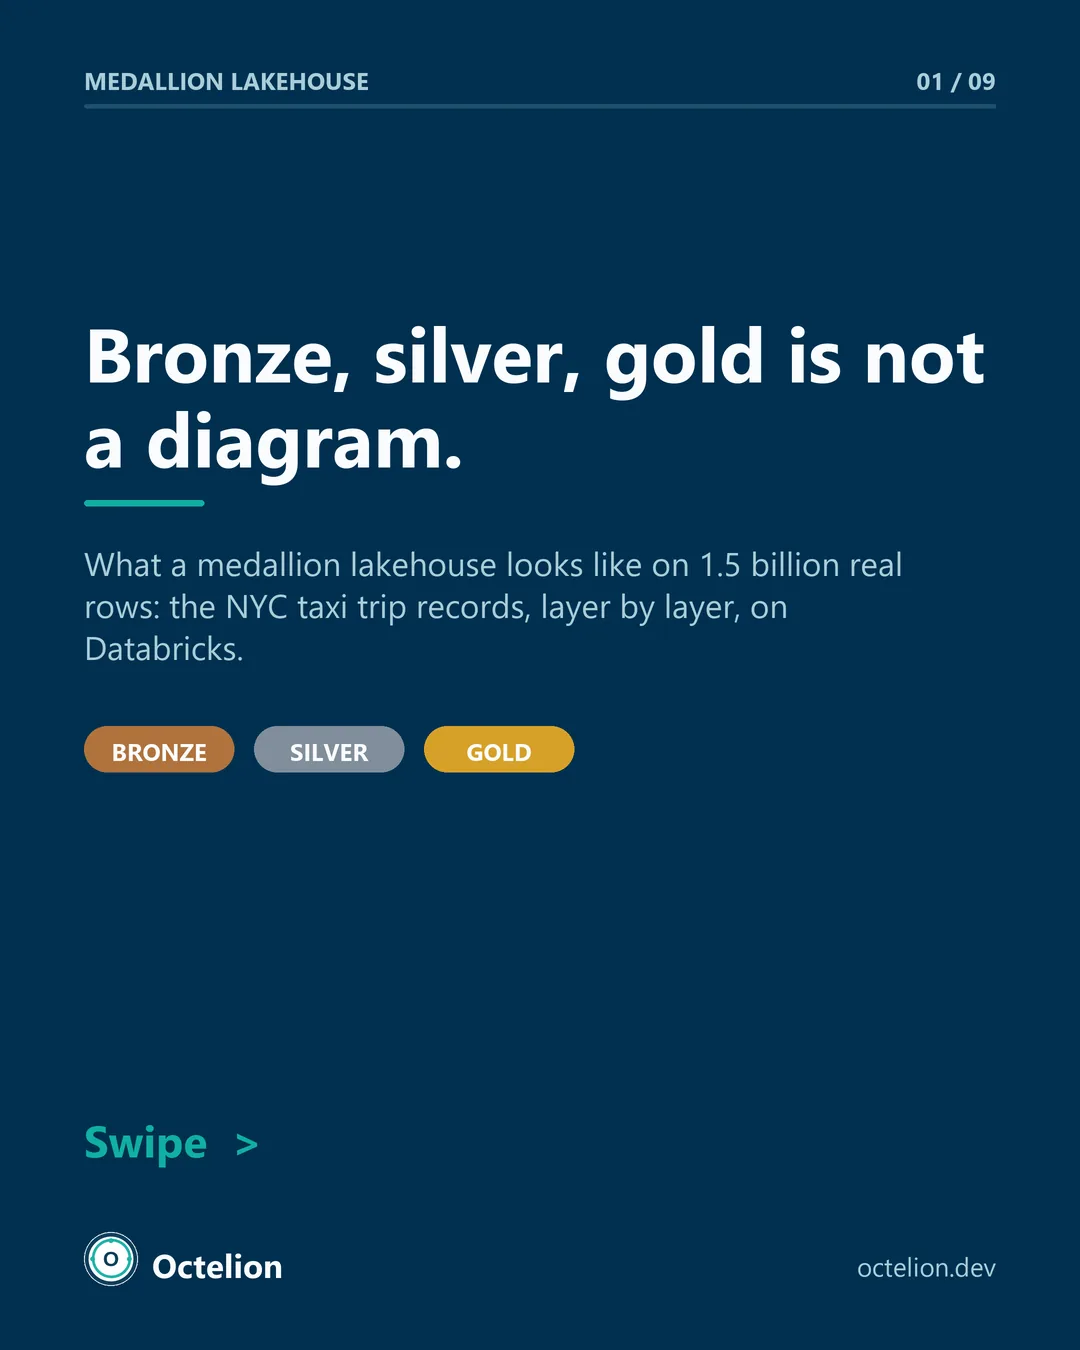
A medallion lakehouse on the NYC taxi data
What each layer promises the next, what happens to a row that cannot keep the promise, and what one month of the data showed when we queried it: 4.3 million rows, 275,565 of them with a negative fare.
Read how the lakehouse was built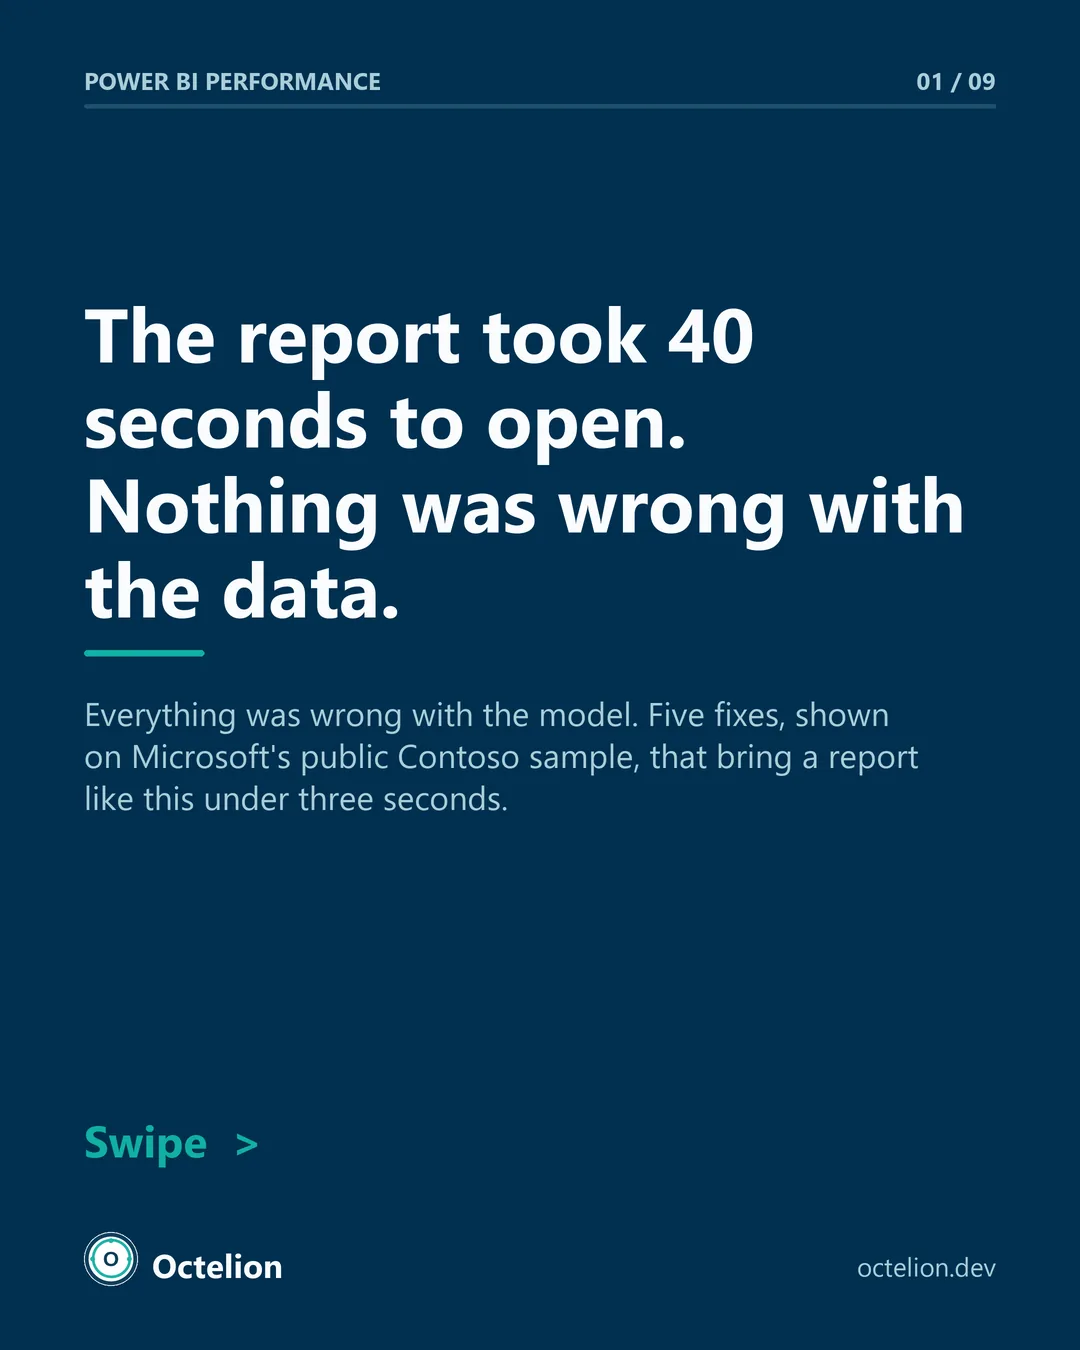
Five fixes that make a slow Power BI report fast
A report of this shape takes about 40 seconds to open on 12 million rows, and nothing is wrong with the data. Five model changes, in the order they should be made, on Microsoft's Contoso sample, with a section on how to tell which fix your model needs.
Read the five fixesHow we publish
Three rules. The data is public, so you can download the same file. The numbers are computed, not quoted, and the query that produced them is shown on the page. Where a figure is a pattern rather than a measurement, the sentence that carries it says so in plain words. If you recompute something and get a different answer, write to us; we would rather fix the page than defend it, and the correction goes next to the original.
Current datasets: NYC Taxi and Limousine Commission trip records, Microsoft's Contoso retail sample. No client data appears anywhere on this site.
SELECT count(*) AS rows,
       count(*) FILTER (WHERE fare_amount < 0) AS negative_fare
FROM read_parquet('yellow_tripdata_2025-06.parquet');Coming next
Three pieces in progress, each written as the question it will answer.
Can an agent file the weekly report without anyone checking it?
What the evals, the approval step and the trace look like when the answer has to be yes, and what the approval step costs in minutes.
What do 4.3 million taxi rows say about data quality?
The rules, the rows that fail each one, the revenue total before and after, and how the counts change month to month.
How do you monitor a lakehouse so the alert reaches a person?
The checks, the thresholds, the message that carries the run link, and the runbook on the other end.
If one of these is a question you are asking right now, say so. Reader questions decide the order, and you do not have to wait for the article.
Have data that looks like this?
Tell us which rules you think yours would fail, or which report takes longest to open. We reply within one working day with questions, not a pitch. Public datasets you want treated this way are welcome too.